Explore Crisil, a company of S&P Global
Formerly known as Global Research & Risk Solutions
May 04, 2026
 Blog
Blog
Blog
Scaling the repayment wall in private credit
May 04, 2026
Blog
Blog
Crucial to distinguish refinanceable debt from those needing liability management
 Share
Share



Executive summary
The private credit market seems to have entered a rolling refinancing cycle. A parsing of public data indicates no imminent break in this cycle because refinancing demand remains high, base rates are lower than a year back and stronger sponsor-backed borrowers still clear the market. However, since early April 2026, vehicle-level liquidity and funding conditions have started coming under the pump.
Situation snapshot
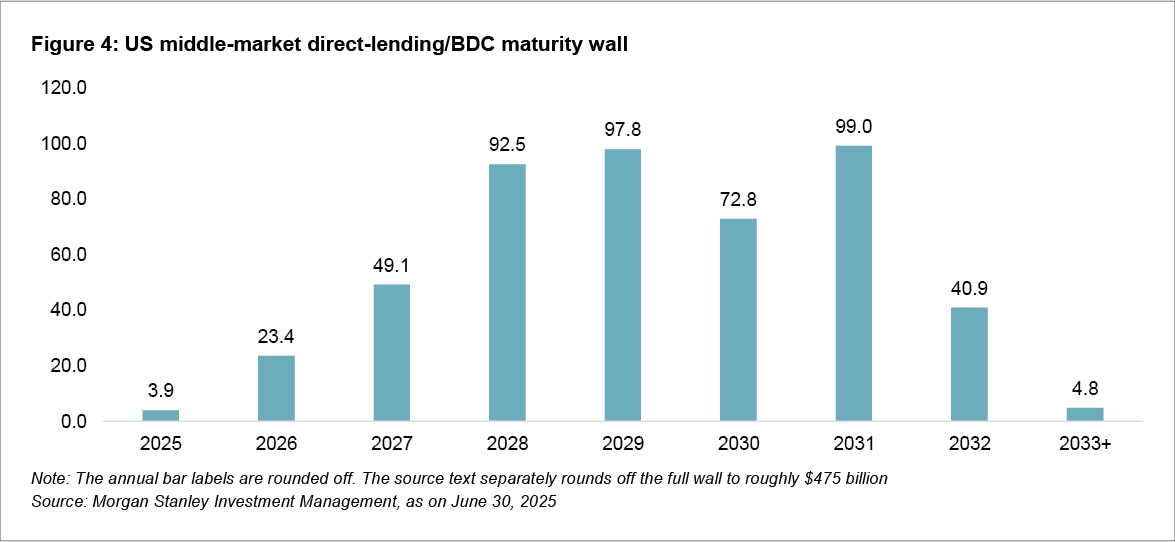
- The private market is staring at a wall of repayments while contracting even more debt: Morgan Stanley estimates maturities in the United States (US) middle market direct lending and business development companies (BDCs) at roughly $475 billion till 2033, with 2028-2031 seeing the maximum concentration and roughly $260 billion maturing in 2026-2029
- Credit quality is not broken, but the tape is less clean at the vehicle level: Kroll Bond Rating Agency’s (KBRA’s) Middle Market Default Monitor (KMDM) for Q4 2025 edged down to 2.0% QoQ by value and 3.4% QoQ by count; yet, downgrades have outpaced upgrades for two full years and Fitch Ratings reported a US private credit default rate of 5.4% in February 2026. Moody's also revised its outlook on US BDCs to negative on April 7, 2026, citing redemption pressure, higher leverage and weaker funding access.
- PIK needs closer monitoring: March 2026 market reporting citing Fitch data put non-cash-generating BDC loan interest at 8% in 2025, while Lincoln International reported that 11% of loans paid some PIK in 2025 and 58% of that PIK was 'bad'
- Rates help, but they do not eliminate dispersion: The secured overnight financing rate (SOFR) was 3.65% on April 6, 2026, and average first-lien middle-market direct-lending spreads were still about 500 basis points (bps) in Q4 2025
The maturity wall should surface first as a refinancing and structuring challenge, not as a broad market shutdown. The reason is straightforward: Most loans have floating rates and are backed by sponsors, ensuring the outcomes are driven to a lesser degree by aggregate debt volumes than by a combination of cash-interest burden, operating momentum, sector-specific disruption and lender willingness to extend or re-paper the capital structure. Overall, lending stress will be sector-driven largely.
The latest public KBRA BDC compendium (till 3Q 2025) still shows median non-accruals are manageable. Newer public credit data for the broader middle-market universe shows downgrades continuing to outpace upgrades, while Fitch's default-rate series and Lincoln's PIK work point to a softer tail than stable net asset values alone would suggest. Early-April 2026 developments also suggest that fund-level liquidity and funding access deserve closer monitoring alongside borrower fundamentals.
For investors, the practical implication is unchanged but more urgent: The next 24 to 36 months are likely to reward lenders with the underwriting reach and restructuring toolkit that can help them differentiate between those who need clean refinancing and those who need liability management. Amend-and-extend transactions, PIK toggles, incremental liquidity, covenant resets, layering of capital and sponsor-supported bridges are likely to matter more than plain-vanilla new-money growth issuance. Vehicle-level liquidity management is also becoming a more important differentiator.
Credit quality: Holding on, but hints of softening
Portfolio values and many BDC net asset values (NAVs) still look comparatively orderly, and public officials are not yet framing the sector as an immediate systemic threat. But the crucial leading indicators are displaying signs that are less reassuring, and by early April 2026 the tone around vehicle-level funding risk had become more cautious. The Q4 2025 KBRA middle-market surveillance update showed KMDM at 2.0% QoQ by value and 3.4% QoQ by count, with downgrades outpacing upgrades for two full years. Meanwhile, Fitch's US private credit default rate stood at 5.4% for the trailing 12 months ended February 2026.
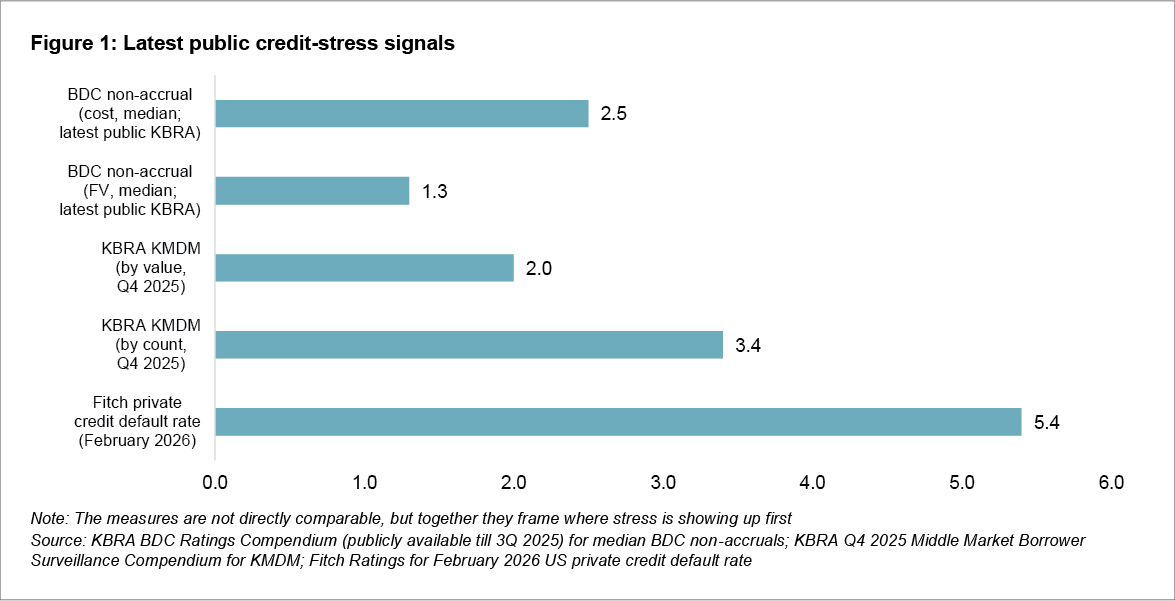
Updated public indicators
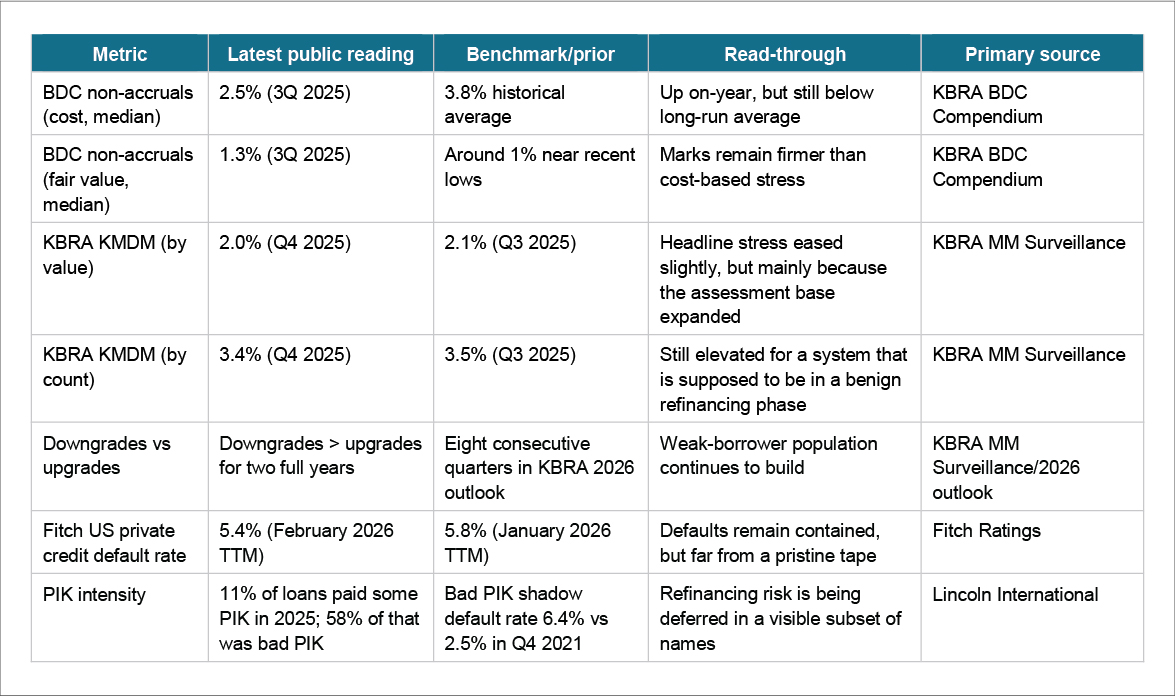
PIK deserves more emphasis: On the one hand, some PIK is planned at origination and can be part of a rational structure, but on the other hand, March 2026 market reporting citing Fitch data put non-cash-generating interest at 8% of all BDC loan interest, the highest level in at least 14 years. Lincoln's year-end 2025 analysis adds an even more useful distinction: 11% of loans carried some PIK interest, but 58% of that was 'bad PIK'—interest that was not being paid in kind at close and later migrated into it. That is more informative than a raw PIK share because it captures a shift from planned flexibility toward cash conservation.
BXSL case study: Stable NAV, but higher quarter-end non-accruals in 4Q 2025
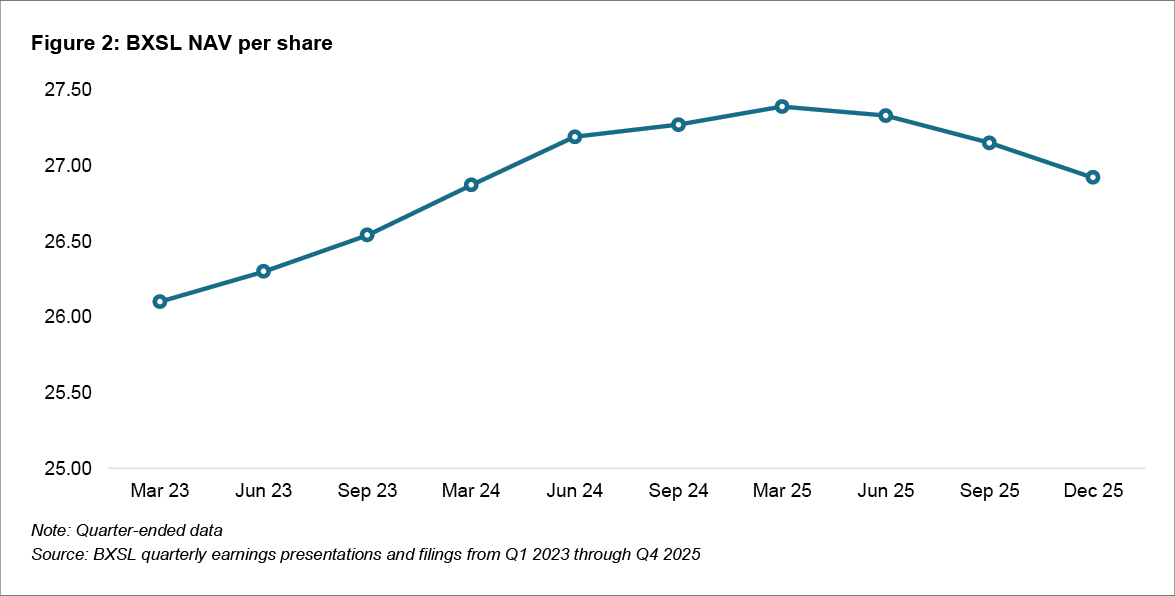
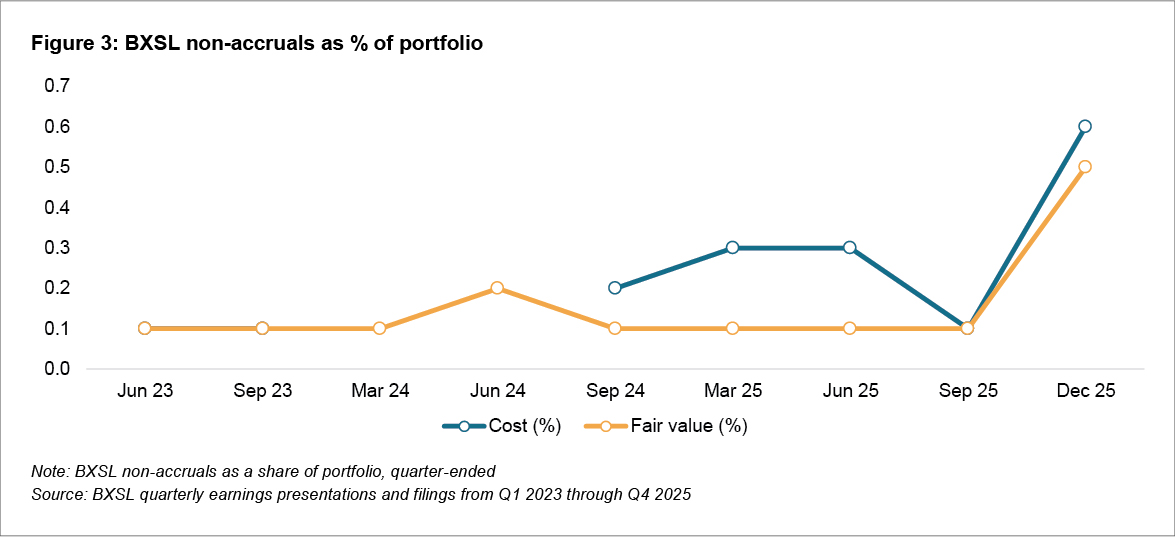
A single BDC dashboard is not a market proxy, but it is a useful bridge between point-in-time credit commentary and what public portfolios are reporting every quarter. Blackstone Secured Lending Fund (BXSL) remains one of the cleaner large BDC case studies, which is precisely why its fourth-quarter move matters: NAV per share declined to $26.92 at end-2025 from $27.15 in 3Q 2025, while non-accruals rose to 0.6% of cost and 0.5% of fair value.
The maturity wall in numbers
The wall is back-end loaded, but the refinancing ramp starts well before the most visible peak years. Morgan Stanley's June 30, 2025, display still provides one of the cleanest public maps of the middle-market maturity schedule. Its headline text frames roughly $475 billion of US middle-market direct-lending and BDC maturities till 2033, with more than half maturing in four years.
Using the annual labels shown in that display, the market still breaks naturally into three phases: A low base in 2025–2026, a sharp acceleration through 2027–2029, and a heavy but still rolling plateau across 2030–2031. That sequencing is important. In practice, lenders and sponsors do not wait for a 2030 wall to act; they begin triaging refinanceability during the 2026–2029 ramp.
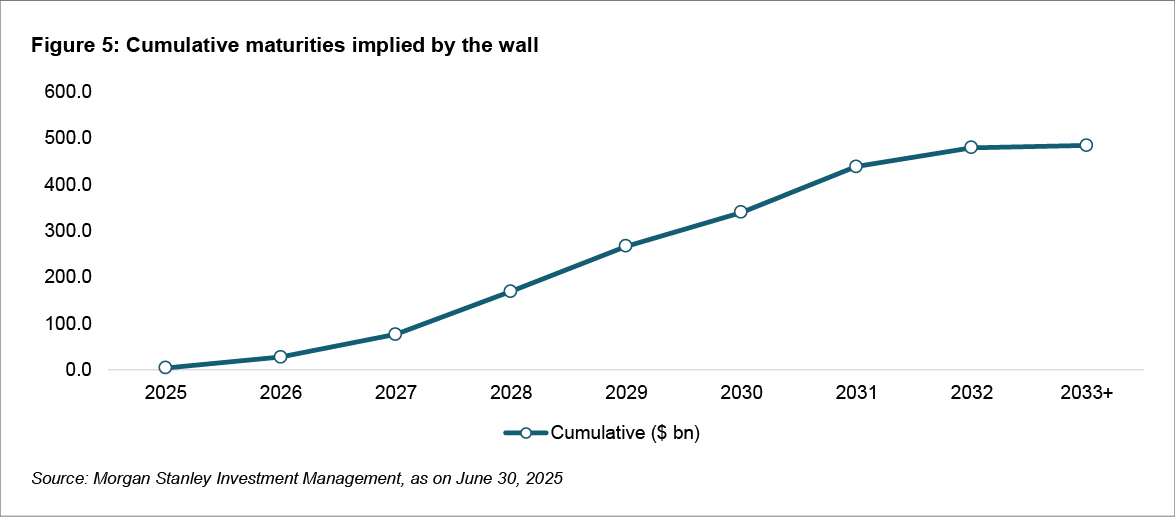
This cumulative profile reinforces the same point. A market that has to absorb roughly $260 billion of maturities across 2026-2029 does not need a generalized default wave to create interesting opportunities. It only needs a meaningful subset of borrowers to encounter a tighter combination of lower growth, elevated leverage, sector disruption and weaker lender appetite.
Refinancing curve: Lower base rates help, but not enough to erase dispersion
Because most private credit loans float, the refinancing curve is unusually sensitive to the base rate. The daily SOFR print was 3.65% on April 6, 2026, materially below the 4.33% seen a year earlier, which helps interest coverage at the margin. But base-rate relief alone does not eliminate the problem. Average first lien middle-market direct-lending spreads were still 500 bps in Q4 2025, unitranche spreads were 508 bps and average first lien all-in yields were 9.16%.
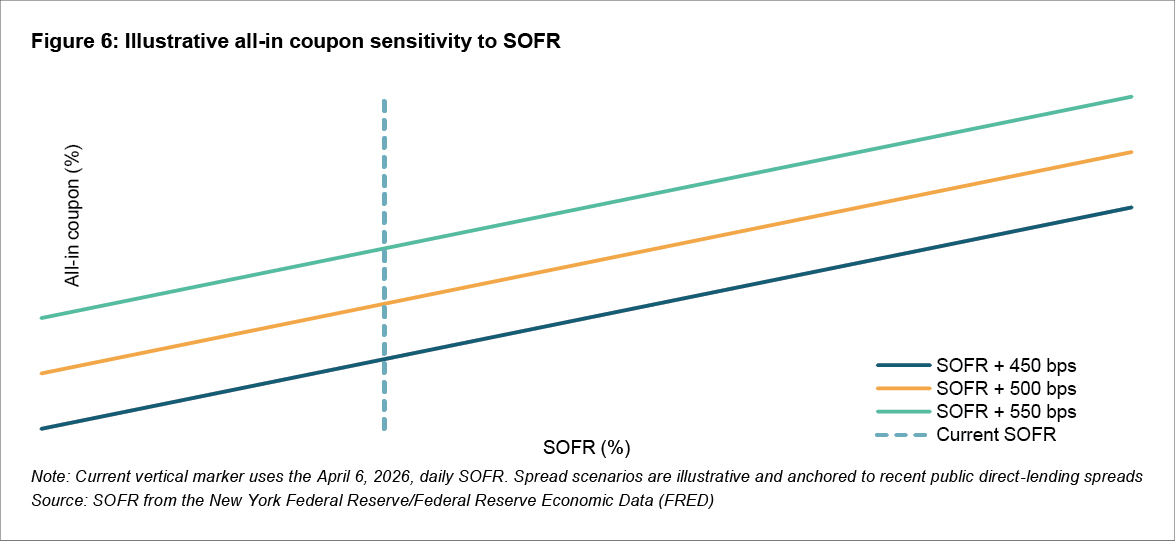
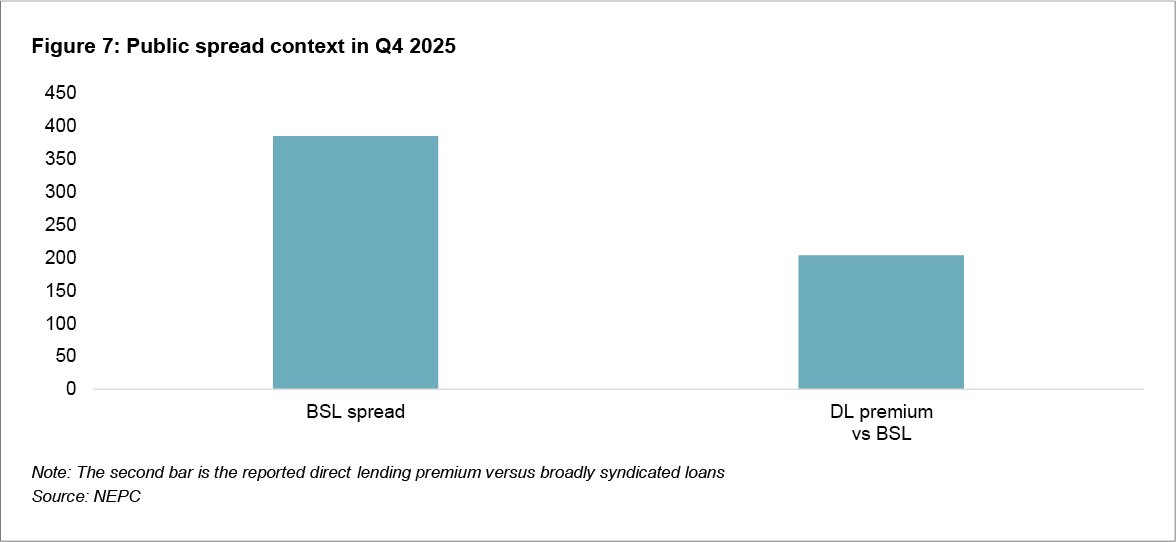
The implication for underwriting is simple. A lower SOFR improves the refinancing math for good credits, but weaker borrowers still need a combination of stronger documentation, sponsor equity, a shorter tenure or liability-management techniques to get through the next stage of the cycle. In software, KBRA's March 2026 work suggests lenders are already tightening terms more selectively where AI disruption risk is judged to be higher.
Where the dispersion is likely to show up first
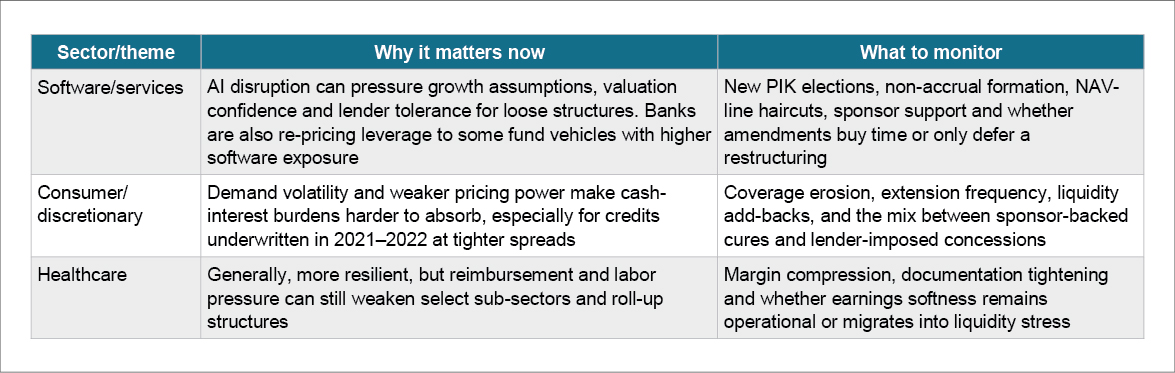
Software and software-enabled services need to be watched closely. In March 2026, KBRA's artificial intelligence (AI) and software work said 41 companies in its higher AI risk group had near-term maturities. If all of them were to default, KMDM would rise to 4.8% by count and 2.9% by value from the Q4 2025 baseline of 3.4% and 2.0%, respectively. That does not prove a software sector-driven problem, but indicates where covenant pressure, PIK toggles and re-mark risk can emerge faster than what broad market averages suggest. Importantly, KBRA also noted that lenders are already responding in some cases with tighter covenants, wider spreads by as much as 100 bps or more, and less willingness to extend maturities for underperforming or more AI-vulnerable companies.
Consumer-facing credits remain the second area to watch. The logic is not novel—lower pricing power and a weaker ability to absorb elevated cash-interest burdens remain the problem—but 2026 market commentary suggests that investors are becoming more sensitive to credits that need repeated maturity pushes rather than clean takeouts.
Risk inventory and practical watchlist
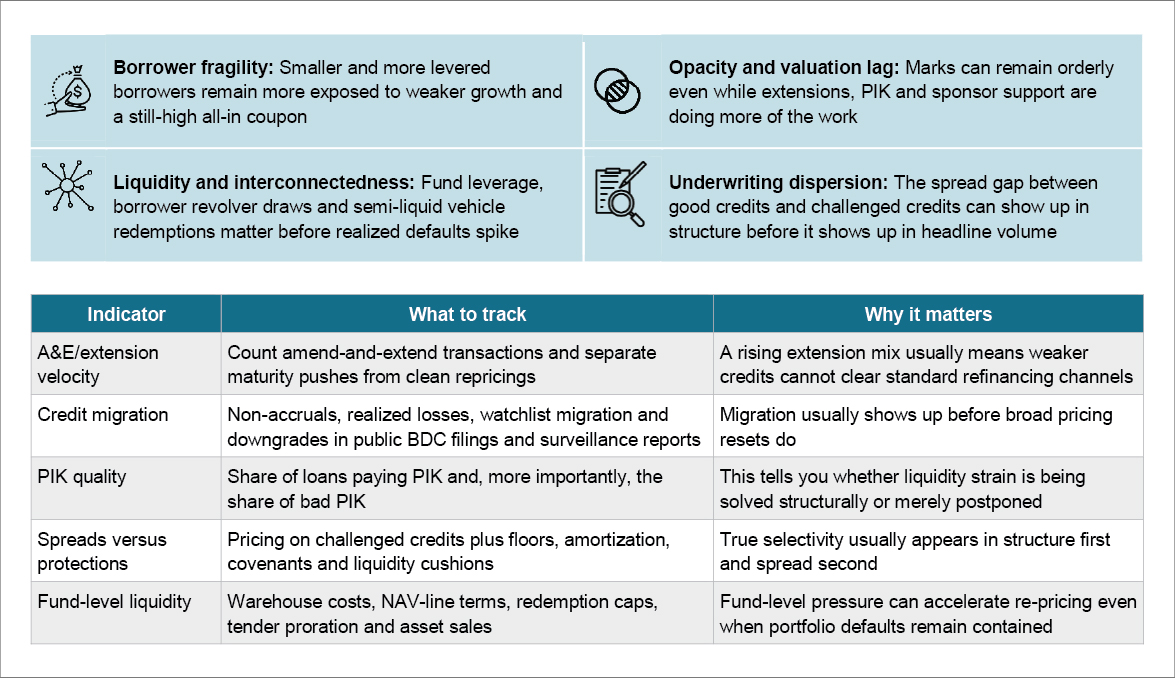
The most useful distinction for investors is a market that has a refinancing risk and a market that is merely deferring it. The following dashboard focuses on that difference.
Conclusion
The private credit maturity wall is still best understood as a refinancing-led cycle and not as an unavoidable cliff. That view remains supported by the still-manageable pace of public default data, the lower base rate vs a year ago and the continued ability of stronger borrowers to refinance.
But it would now be too generous to describe the tape as merely a borrower-level credit story. Downgrades have surpassed upgrades for eight quarters, public default proxies have remained elevated relative to pre-2024 levels, and PIK has become a more meaningful sign of cash-flow strain. In addition, early-April 2026 developments in BDC and semi-liquid fund redemptions suggest that vehicle-level liquidity and funding access have become a more visible overlay to the credit cycle. In other words, private credit continues to see demand, though it is experiencing stress in certain sectors and funding channels.
For a private credit investor, this means there is an opportunity to widen the spread through refinancing, amendment and restructuring capabilities rather than pure growth underwriting. The next phase of returns is likely to be gained by lenders who can distinguish a refinanceable credit from a deferrable problem—and who can manage their own funding and liquidity profile while doing so.
Appendix
Sources
Morgan Stanley Investment Management, “Weighing in on Direct Lending: Analyzing Durability & The Supply Demand Balance” (October 2025), Display 3 (as of June 30, 2025)
KBRA, “Private Credit: Deep Dive on AI and Software” (March 2026)